Turn Your Recruitment Data into Actionable Insights with Visual Reporting
Making sense of recruitment data shouldn’t feel like solving a puzzle. You’ve got applications flowing in, jobs going live, and hiring timelines to track, but turning all that information into actionable insights has been a challenge. That changes today with Visual Reporting, our new feature in :Recruit that transforms complex recruitment data into clear, powerful visualizations that drive better hiring decisions.
What’s New in a Nutshell
- Instant visual insights into monthly application and job posting trends
- Purpose-built recruitment metrics including time-to-hire analysis and application tracking
- Flexible data grouping: by location, source type, job state, and more
- Pre-built report templates for common recruitment scenarios
- Entity-level filtering to analyse specific business units or departments
What This Means For Your Team
Track Where Your Best Candidates Come From:
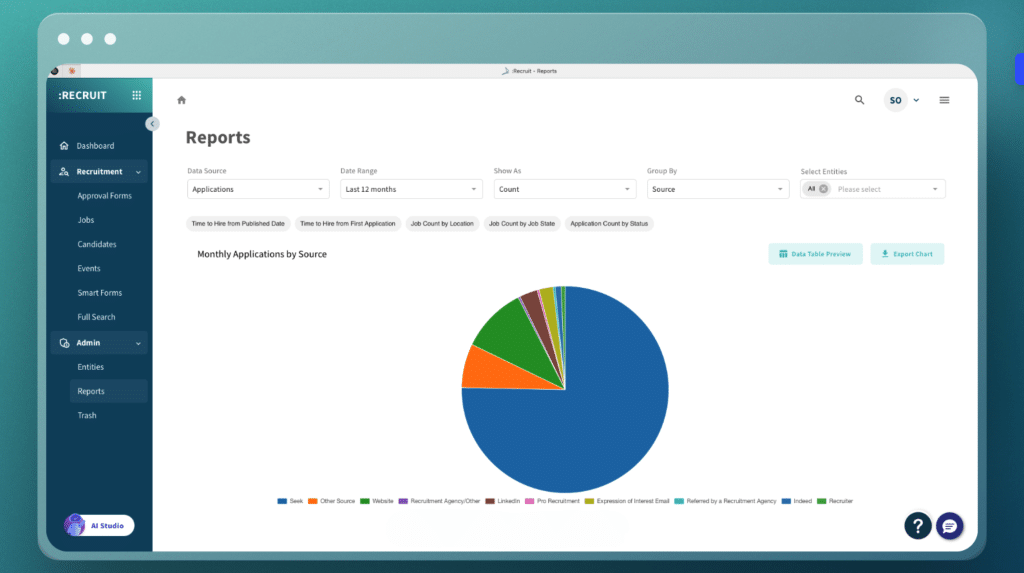
Monitor application trends across different sources, states, and channels. Identify which job boards, referral programs, or recruitment strategies bring you the highest volume and quality candidates, then allocate your budget accordingly.
Understand Your Hiring Demand Patterns:
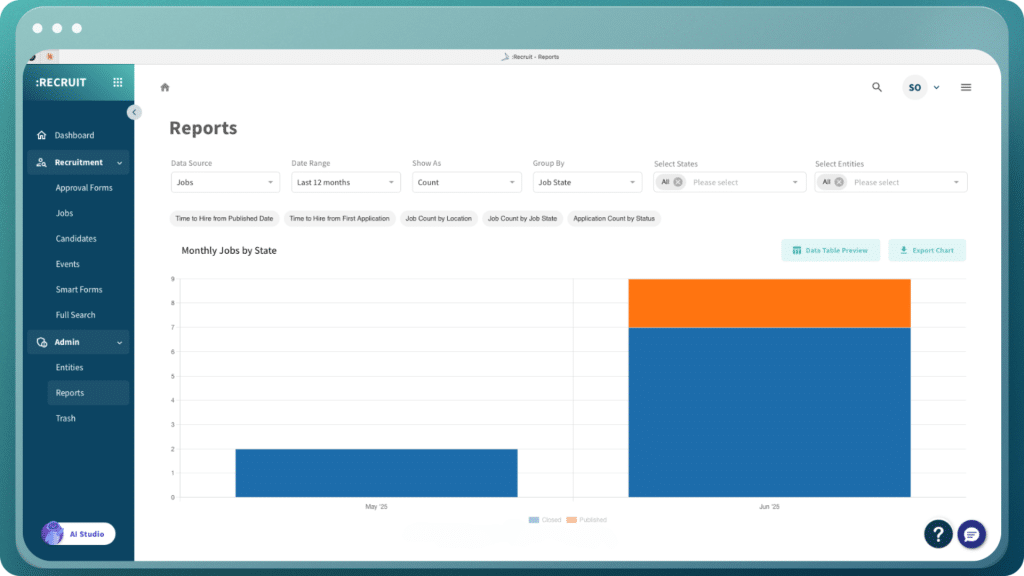
Visualize job posting volume across locations, departments, and time periods. Spot seasonal hiring trends, compare internal versus external recruitment activity, and plan your talent acquisition strategy based on actual demand patterns.
Measure and Improve Your Time-to-Hire:
Track how long it takes to move from job posting to successful hire across different roles and locations. Identify bottlenecks in your recruitment process and benchmark your performance against your own historical data to drive continuous improvement.
Access Insights in Seconds, Not Hours:
Skip the data export and spreadsheet dance entirely. Load pre-configured reports instantly or customise your view with simple dropdown selections, then generate visual insights for the past year with a few clicks.
A Deeper Dive: How Visual Reporting Works
Visual Reporting is designed specifically for recruitment teams who need to understand their hiring performance at a glance. Unlike generic business intelligence tools, this feature speaks your language with recruitment-focused metrics and workflows.
The system transforms your existing :Recruit data into dynamic charts and graphs that reveal patterns you might miss in spreadsheets. Whether you’re tracking where your best candidates come from, monitoring seasonal hiring trends, or identifying bottlenecks in your recruitment process, Visual Reporting gives you the clarity to make informed decisions quickly.
What makes this powerful for recruitment teams:
You can analyse application volume trends across any time period, helping you anticipate busy seasons and allocate resources accordingly. The job posting analytics show you exactly how your hiring demand fluctuates, whether you’re expanding in specific locations or shifting between internal and external recruitment strategies.
The time-to-hire functionality is where Visual Reporting truly shines. You can measure the efficiency of your recruitment process from multiple starting points: when the job was published, when the first application arrived, or when the requisition was approved. This flexibility helps you identify exactly where delays occur and optimize your workflow accordingly.
Smart customization without complexity:
Every chart can be grouped by relevant recruitment dimensions. For applications, you might group by state to see regional trends, by source type to evaluate your job board performance, or by specific sources to understand which platforms deliver the best candidates. For jobs, grouping by location reveals hiring hotspots, while internal versus external grouping shows your sourcing strategy balance.
How to Get Started
- Navigate to Reports by visiting here.
- Navigate to The Visual Reports Tab.
- Choose your approach: Select from preset report templates or customize completely with data source selection
- Pick a preset template (if using templates): Choose from “Time to Hire from Published Date,” “Time to Hire from First Application,” “Job Count by Location,” “Job Count by Job State,” or “Application Count by Status”
- Select your data source (if customizing): Choose “Applications” for candidate activity data or “Jobs” for posting and hiring timeframe data
- Configure your visualization: Select “Count” for total numbers or “Average Time” for time-to-hire metrics (Jobs only)
- Choose time comparison (if using Average Time): Select from “Job Published to Hired,” “First Application Date to Hired,” or “Requisition Approved to Hired”
- Group your data: For Applications, group by State, Source Type, or Source. For Jobs, group by Location, Internal/External, or Job State
- Apply entity filters (optional): Limit your report to specific business units or departments
- Wait for data processing: If this is your first time using reports, allow time for the initial data download to complete
- View your report: Your visualization will appear below the configuration fields once processing is complete
Frequently Asked Questions (FAQ)
What data sources can I use for Visual Reporting?
You can choose between two main data sources: “Applications” for analyzing candidate activity and engagement, or “Jobs” for examining job posting performance and hiring timelines.
How far back does the historical data go?
Visual Reporting displays data for the past 12 calendar months by default, giving you a full year’s perspective on your recruitment trends.
What’s the difference between Count and Average Time visualizations?
Count displays total numbers (like total applications received or jobs posted), while Average Time shows time-based metrics such as how long it takes to hire from various starting points. Average Time is only available when using “Jobs” as your data source.
Can I filter reports for specific departments or business units?
Yes, you can use entity-level filtering to focus your reports on specific business areas. This defaults to “All” but can be customised to show data for particular departments or regions.
What grouping options are available?
For Applications data, you can group by State (geographic distribution), Source Type (job board categories), or Source (specific platforms). For Jobs data, you can group by Location, Internal/External status, or Job State.
Do I need to wait every time I generate a report?
Only during your first use or after extended periods without accessing reports. The system downloads and processes your historical data initially, but subsequent report generation is much faster.
What preset report templates are available?
You can choose from five preset options: “Time to Hire from Published Date,” “Time to Hire from First Application,” “Job Count by Location,” “Job Count by Job State,” and “Application Count by Status.” These templates pre-fill all settings for instant insights.
With Visual Reporting, you get recruitment-specific insights, not generic analytics. It turns your hiring data into a powerful tool for strategic advantage, allowing you to identify trends, refine processes, and make informed decisions. If you’re new to :Recruit, you can request a demo here for your organization’s unique needs and goals.